 AsrielNetworks
Enterprise plan: how to use it
Everything on the Enterprise tier, module by module. Enterprise adds the control layer: the causal capability firewall with counterfactual replay, playbooks, custom detection rules, the secure terminal, team management, SSO and SCIM, exports, and the evaluation lab.
The first hour
- Create the workspace Sign up with your company and role; the workspace, your membership and the subscription are provisioned on the spot. Get the product from the products page; the three questions there set your defaults.
- Connect one application Open Connect AI: register the model deployment, mint a credential scoped to your application and agent, and point the application at AsrielNetworks (SDK, gateway or your own emitter).
- Watch the Overview Within a minute of the first request the tiles move and the attack graph shows the stages. If nothing arrives, Connect AI's third step tells you what it is waiting for.
- Set who gets told In Settings → AI Incident Response set severities and the escalation chain; add the channels your plan includes.
- Open your first incident Run one deliberately bad request through the connected application (a denied tool call is enough). Read it in AI Incidents: queue, investigation, evidence, response.
Overview
Overview
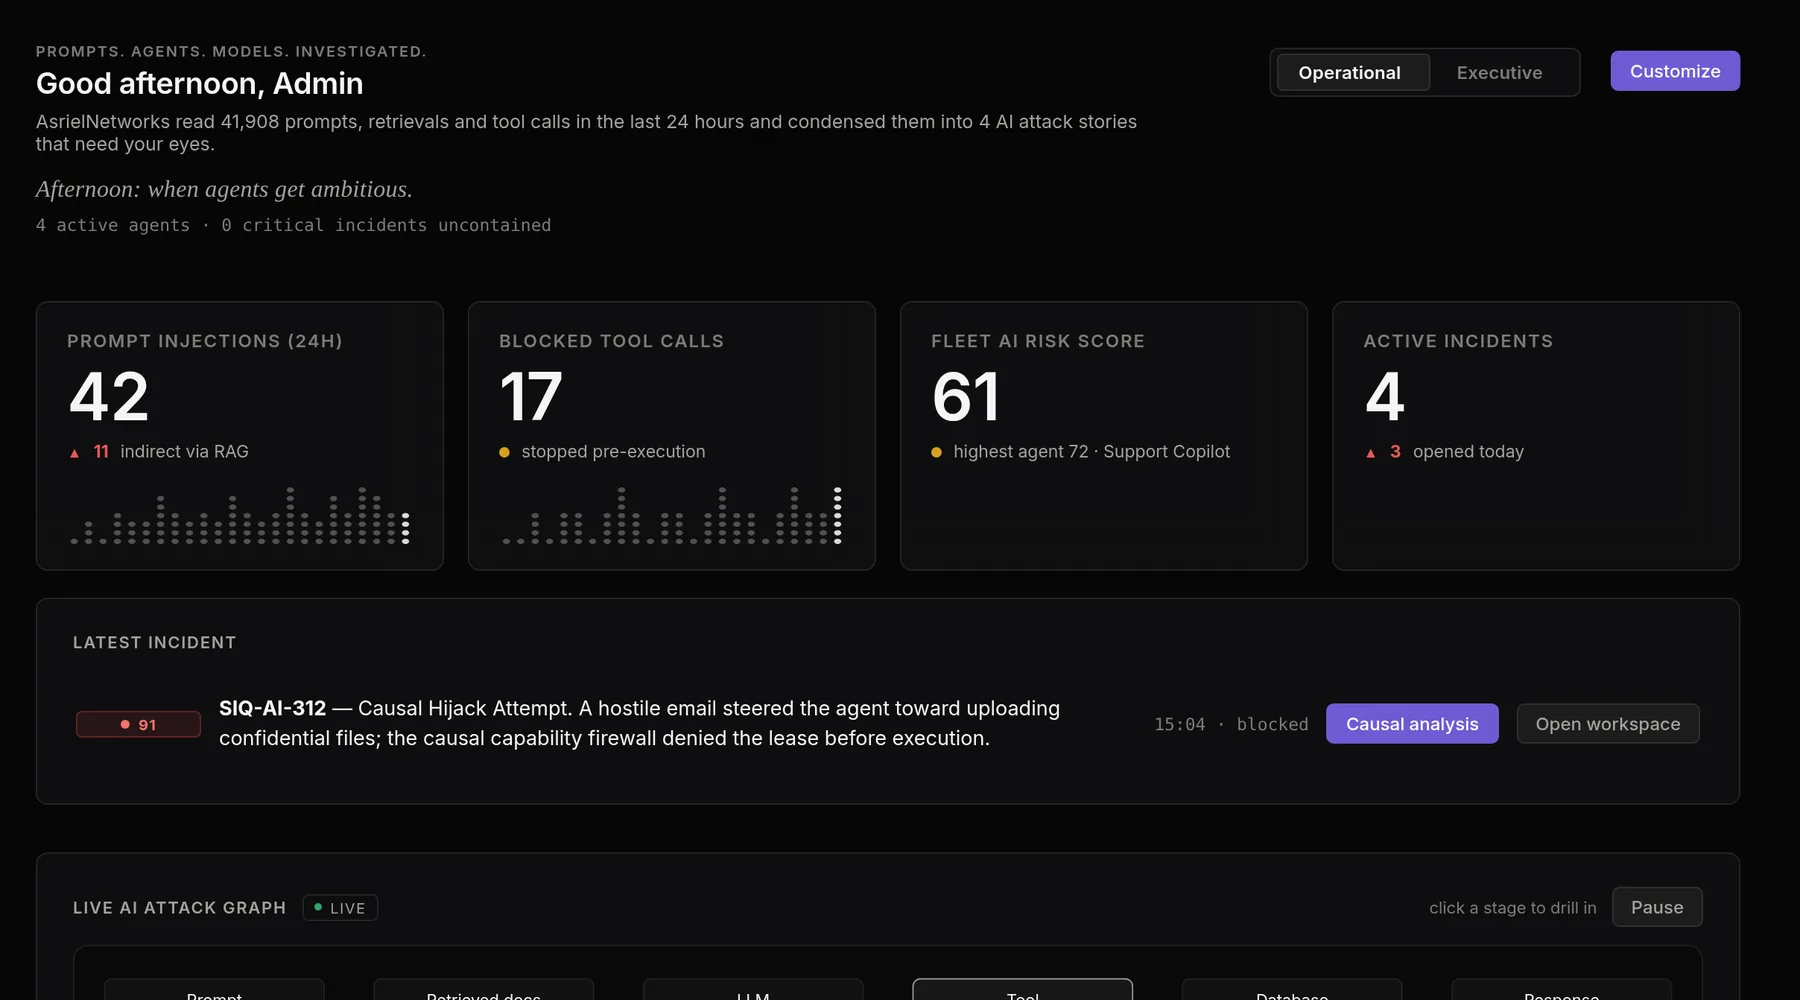
freeThe first screen after sign-in. It condenses everything the platform read in the last 24 hours into four numbers, the latest incident, and a live picture of where prompts are flowing.
Open it when: Start of a shift, after a deploy, or whenever someone asks “is anything wrong right now?”
How to use it
- Read the four tiles left to right: Prompt injections (24h), Blocked tool calls, Fleet AI risk score, Active incidents. Each carries a small delta and a sparkline; a rising sparkline with a flat incident count usually means detections are being contained before they become incidents.
- Open Latest incident when the badge is red. The two buttons take you into the incident workspace (Open workspace) or, on plans that have it, straight to the causal analysis.
- Use the Live AI attack graph to see the stages a request passes through (prompt, retrieved docs, LLM, tool, database, response) and where things are being refused or held. Click a stage to drill into the events behind it; Pause freezes the feed while you read.
- Switch Operational to Executive for the same data as a management summary. Customize lets you pick which tiles you see.
- The sentence under the greeting is generated from your own telemetry (how many prompts, retrievals and tool calls were read, how many incidents they produced). It is a status line, not a chat.
Reading the screen
- Fleet AI risk score is 0 to 100 across every agent; the tile names the agent that is pulling it up.
- Blocked tool calls counts calls the policy refused before execution; a call that executed and was flagged afterwards is a finding, not a block.
- Active incidents counts open incidents, not findings; several findings on one trace roll into one incident.
AI attack stories
proThe incident told as a story: the prompt, the retrievals and the tool chain narrated in plain English, so a person who was not in the trace can understand what happened in a minute.
Open it when: Handover, the daily stand-up, and any time you have to explain an incident to someone outside the SOC.
How to use it
- On the Overview, the story panel lists the day's attack stories; each opens the incident with the narrative at the top of Investigation.
- Read the story, then verify it against the trace below it; every sentence links to the events it was written from.
- Promote a story to a Case when it needs tracking beyond the incident (see Cases).
Reading the screen
- Stories are generated from structured events, not from prompt text, so they exist even when your telemetry redacts content.
- They are evidence-linked, which is what separates them from a summary you could get from any model.
Cases
proA tracked piece of work above the incident: a story promoted to a case, ranked P1 to P3, with an owner, comments, evidence attached, and a timeline to closure.
Open it when: When an incident needs more than one person, more than one day, or a paper trail.
How to use it
- Promote from a story or an incident (Promote to case). Rank it P1 to P3 and assign an owner.
- Attach evidence from the incident's Evidence tab; it is sealed, so the case carries hashes you can rely on later.
- Work it in the case timeline: comments, status changes and actions are all recorded. Close it with a resolution; the incident's status follows.
Reading the screen
- A case can span several incidents (the same campaign hitting several agents); incidents stay individually scored.
- Cases appear in governance reporting as the human record that something was handled.
Investigate
AI Incidents
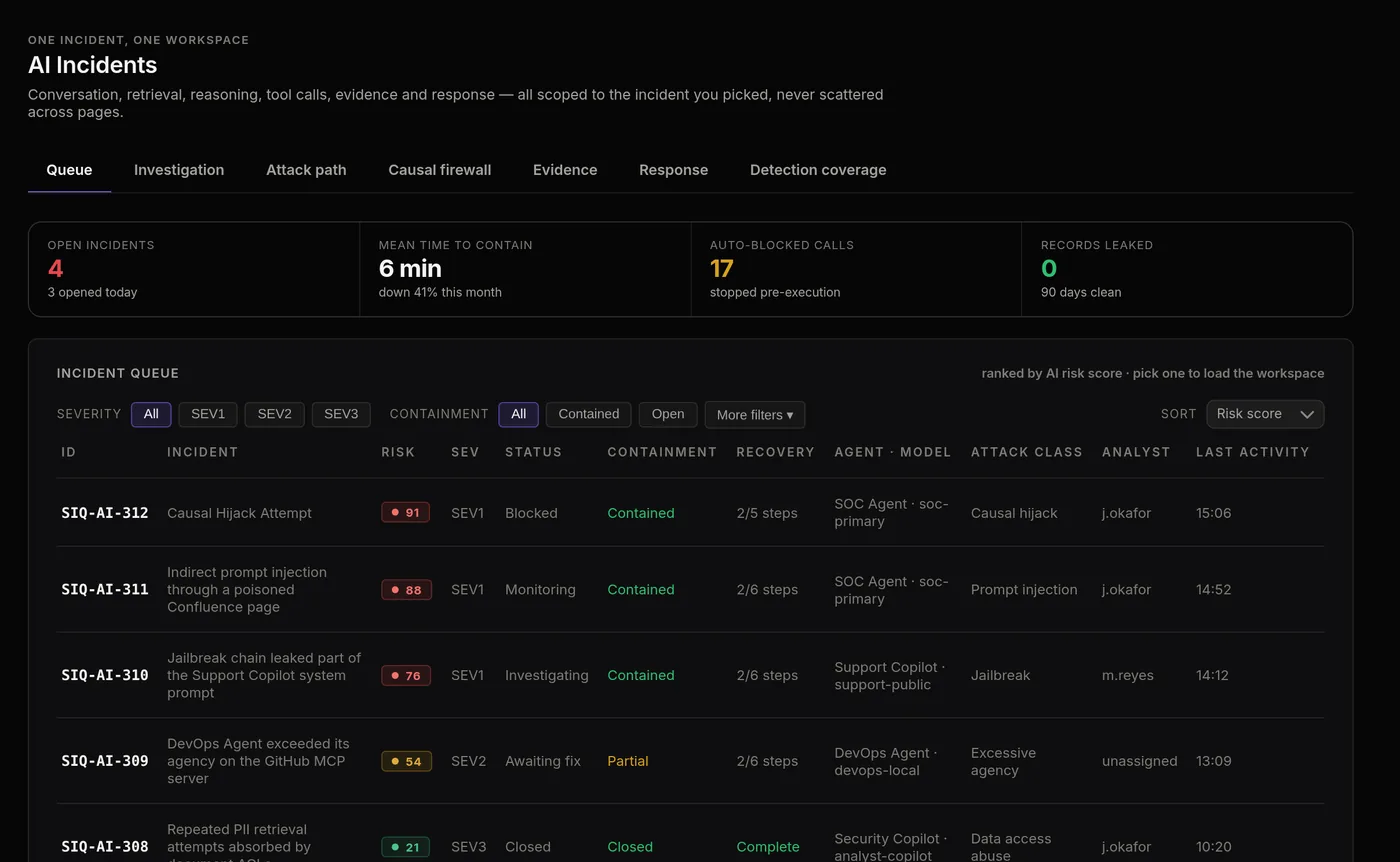
freeThe incident workspace. Every finding the detection engine raises lands here, correlated into an incident with a risk score, and everything about that incident is on one screen: the conversation, the retrievals, the tool calls, the evidence and what was done about it.
Open it when: Anything red on the Overview, an alert email, or the daily review of the queue.
How to use it
- In Queue, incidents are ranked by AI risk score. Filter by severity (SEV1 to SEV3) and containment (contained, open). The columns tell you the status, how far recovery has got (2/5 steps), which agent and model were involved, the attack class, and who is working it.
- Pick an incident to load the workspace. Investigation shows the trace in order: the prompt that started it, what was retrieved, what the model reasoned, what it proposed, what the policy decided, what executed. Findings are attached to the events that raised them.
- Evidence holds the sealed record: hashes of the events, the raw structured signals the detectors used, and the redaction state of each item. Sealed evidence cannot be edited or deleted; that is what makes it usable later.
- Response is where you act. Actions lists the response plan derived from the rules that fired (block a tool, revoke a credential, suspend an agent, quarantine a document); each shows whether it needs approval. Recovery tracks the steps to closure.
- Set the status as you go (investigating, contained, resolved) and assign an analyst; the queue and the Overview update immediately.
- Tabs that your plan does not include stay visible with a lock: Attack path and Detection coverage open on Pro, Causal firewall on Enterprise.
Reading the screen
- Risk is the incident's score (the highest severity, weighted by confidence and how far it got).
- Containment answers “can it still do harm?”; Status answers “are we done?”. An incident can be contained and still under investigation.
- Attack class is the detection category: prompt injection, excessive agency, data access abuse, supply chain, causal hijack.
Session Replay
freeA recorded session played back one frame at a time: prompt, retrieval, model, reasoning, guardrail, tool, and what the guardrail did about it. It is the same trace the Investigation tab shows, presented as a timeline you can step through.
Open it when: When you need to explain to someone else exactly how a bad outcome happened, or to check what the model saw at the moment it chose a tool.
How to use it
- Pick a session from the selector (incidents link straight to theirs).
- Use the transport controls: Play runs the chain at reading speed; the arrow buttons step one frame; the end buttons jump to the first or last frame.
- Each frame shows the event's kind, its structured data (for a tool call: the tool, its category, the policy decision), and any finding raised on it. A Blocked frame means the guardrail or policy stopped the chain there.
- The chain strip at the top (Prompt, Retrieval, LLM, Reasoning, Guardrail, Tool, Blocked, Response) is clickable: jump to the stage you care about.
Reading the screen
- Content shown is subject to your telemetry settings: if prompts are redacted at the source, the frame shows the structured signals and the redaction state, not the text.
- Reasoning frames are the model's own summaries where the runtime emits them; they are evidence of what was considered, not a transcript.
Prompt & Event Explorer
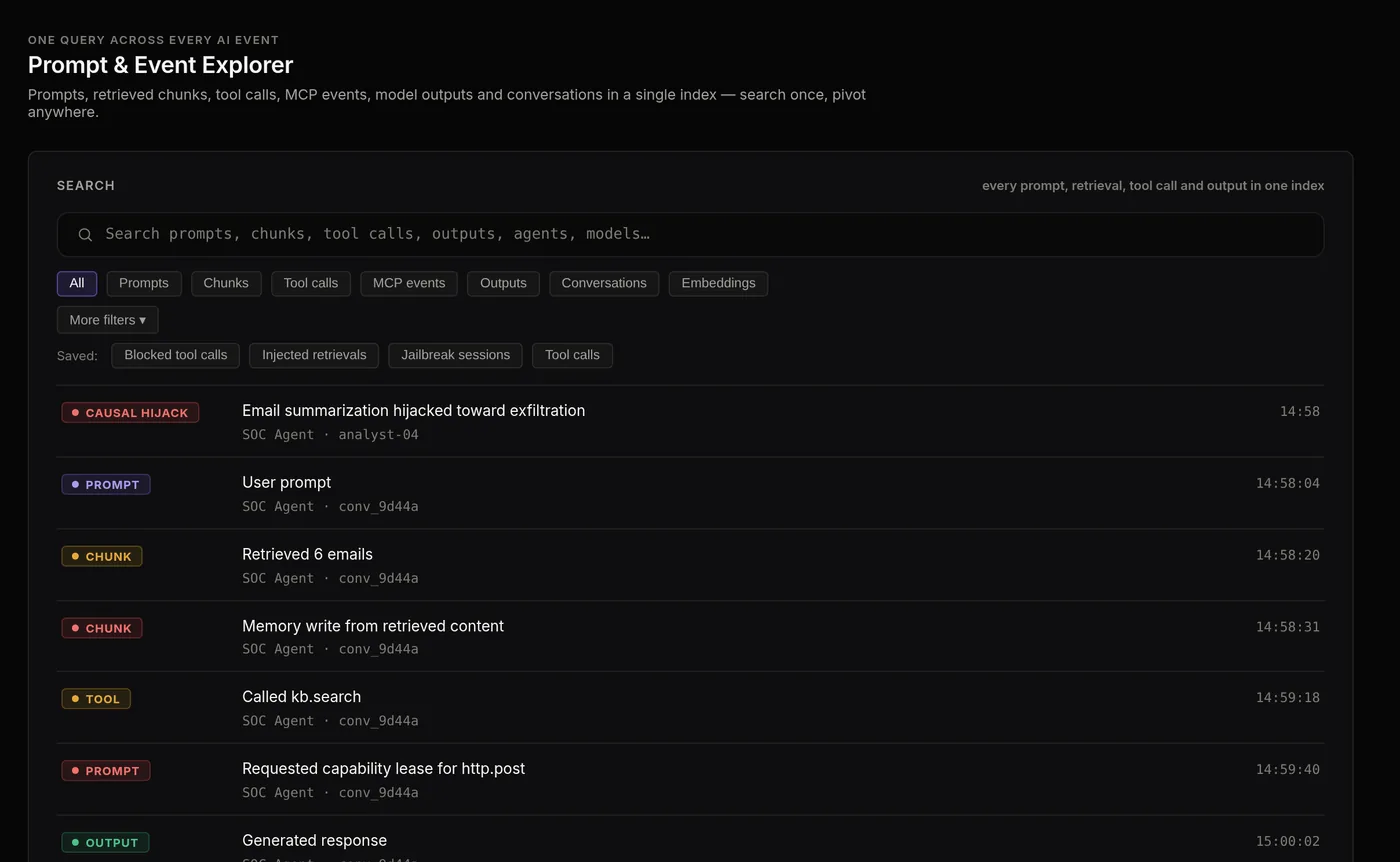
freeOne search box over every AI event: prompts, retrieved chunks, tool calls, MCP events, model outputs, whole conversations, even embeddings. Search once and pivot to the incident, the agent or the session.
Open it when: Hunting: “did any agent ever call http.post to that host?”, “which sessions retrieved this document?”, “show me every jailbreak attempt this week”.
How to use it
- Type a term. The index matches tool names, document ids, agent and session references, and the text of prompts and outputs that your telemetry settings allow to be stored.
- Narrow with the type chips: Prompts, Chunks, Tool calls, MCP events, Outputs, Conversations, Embeddings. More filters adds agent, model, time window and policy decision.
- Use the Saved searches (Blocked tool calls, Injected retrievals, Jailbreak sessions) as starting points, and save your own once a query proves useful.
- Each result row shows the event kind, its title, the agent and the session; click through to the session or the incident it belongs to.
Reading the screen
- Kinds are the platform's event vocabulary:
prompt.received,document.retrieved,tool.proposed,tool.denied,tool.execution.completed,response.deliveredand so on. - A row tagged with a finding badge (for example causal hijack) is an event a rule fired on.
Unified Graph
freeOne picture of how the organization's AI hangs together: which agent ran which prompt, on which model, what it retrieved, which tools and standing grants it holds, and which incidents came out of it.
Open it when: When a change is planned (“what depends on this MCP server?”) and when an incident needs context (“what else does this agent touch?”).
How to use it
- Choose a layer: AI estate (agents, models, tools, corpora and the grants between them) or Security evidence (the same nodes with findings and incidents attached).
- Pick the window: 1h, 24h or 7d. Edges only appear for relationships observed in that window, so the 7-day view is the honest map of what the estate really uses.
- Click a node to see what it connects to; the side panel lists the edges with their evidence (the events that proved the relationship).
Reading the screen
- A grant edge (agent to tool) is standing permission; a call edge is an observed use. An agent with grants it never uses is a good candidate for tightening.
- This page reads live relationships from the API; it has nothing to show until telemetry has arrived.
Attack path (incident tab)
proThe incident drawn as a path of nodes, from the first prompt to the last effect, with the point where the attacker gained control marked. It is the graph form of the story.
Open it when: Reconstructing how a multi-step attack unfolded, and deciding where a control would have stopped it.
How to use it
- Open an incident and the Attack path tab. Nodes are events (prompt, retrieval, reasoning, tool, effect); edges are what led to what.
- Read the note under the path: it names the pivot (the retrieval or the prompt that changed the agent's course).
- Click a node for its event, its finding and its evidence entry; use it to answer “which control would have broken the chain here?”.
Reading the screen
- A path is reconstructed from the trace, not guessed: if the runtime did not emit an event, the path shows the gap.
- Free-plan consoles show this tab locked; the API withholds the path fields on Free as well.
Detection coverage (incident tab)
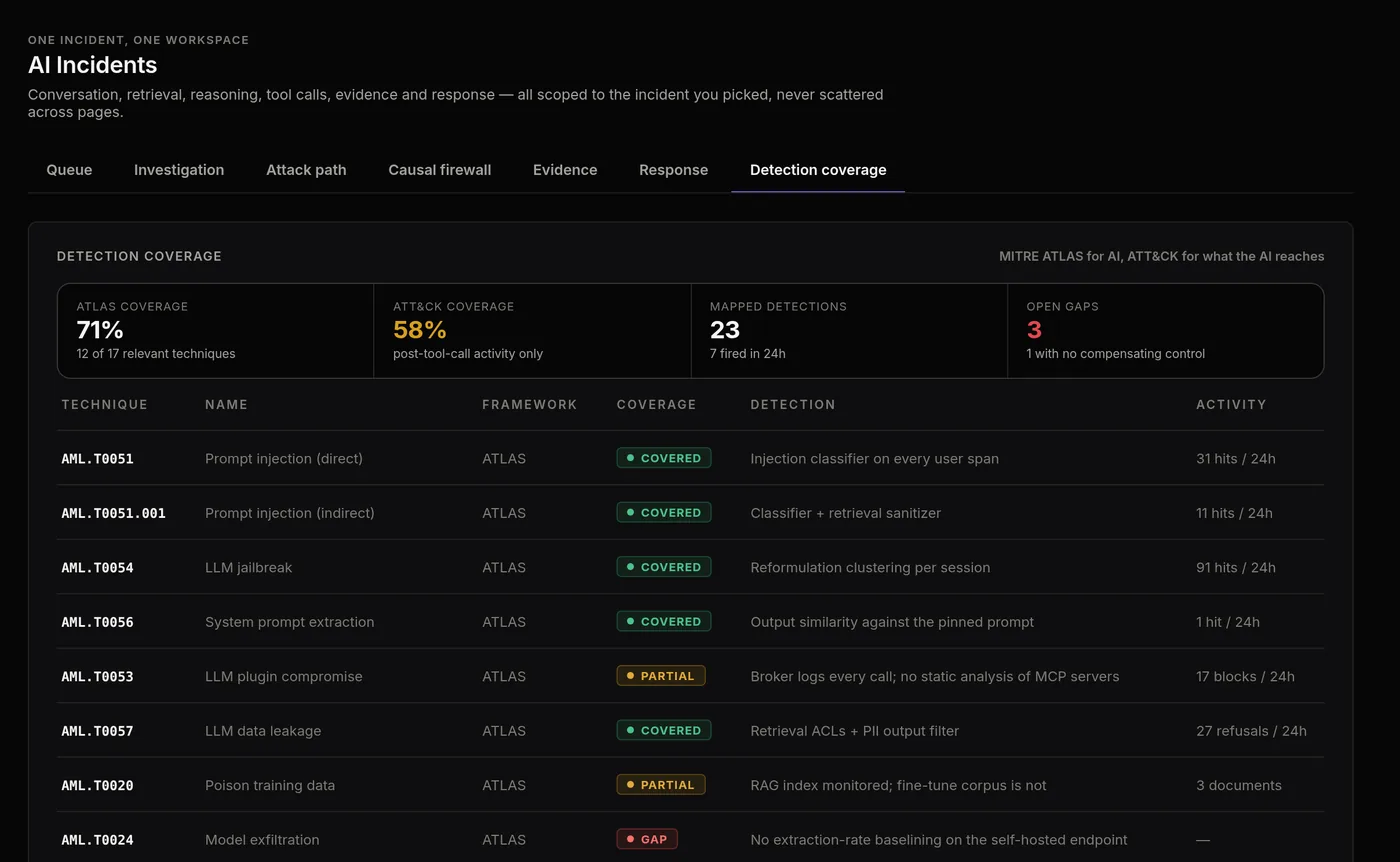
proWhich attacker techniques the platform can see, mapped to MITRE ATLAS and ATT&CK: covered, partial, or a gap, with the rule that covers each and how often it fired in the last day.
Open it when: Quarterly reviews, audits, and when someone asks “would we catch X?”.
How to use it
- Open any incident and the Detection coverage tab (it is organization-wide, not per incident).
- Read the tiles: ATLAS coverage, ATT&CK coverage (post-tool-call activity only), mapped detections, open gaps with no compensating control.
- Each technique row names the framework, the coverage status, the detection that covers it (for example Injection classifier on every user span) and 24-hour activity. A gap row says what would close it.
- Export the table for an audit; the Learn pages explain the techniques.
Reading the screen
- Coverage is computed from the rules enabled in your tenant and the telemetry you actually send: turn off prompt capture and some techniques become partial.
- Activity counts are hits of the rule, not incidents; many hits with few incidents is the expected shape.
Causal capability firewall
enterpriseThe flagship: a causal trace of the incident (what influenced what), capability leases that decide what an agent may do next based on that trace, counterfactual replay to test “what if this control had been in place”, and semantic influence tracking that follows a piece of retrieved content through the agent's decisions.
Open it when: High-severity incidents, and before changing a control, to know what it would have changed.
How to use it
- Open the incident's Causal firewall tab. The graph shows nodes (prompt, retrieval, reasoning, proposal, lease, effect) with their state (trusted, tainted, held) and the why behind each edge.
- Capability leases: each risky action needed a lease; the panel shows whether it was granted, denied or held, by which policy, and the proof (the events the decision was made on). Denied leases are how the firewall stopped the effect before execution.
- Counterfactual replay: pick a control (a tool gate, a trust threshold, an allowlist), replay the trace with it applied, and see where the chain would have stopped. Replay in record mode keeps the replay as evidence.
- Semantic influence: select a retrieved chunk or a prompt span and see every later decision it influenced, across agents when they share a session (multi-agent correlation).
Reading the screen
- A lease is a decision in the request path, not a report after the fact; the API refuses replay on plans without the feature and withholds the causal fields.
- Replay never executes anything: it re-evaluates recorded events against the chosen control.
Playbooks
enterpriseResponse, written down once and run the same way every time: a sequence of actions (block, revoke, quarantine, notify, open a case) with approvals where you want them, triggered by a rule or run by hand from an incident.
Open it when: Anything you have done twice by hand.
How to use it
- In an incident's Response → Playbooks, pick a playbook and run it; each step reports what it did, and steps marked for approval wait for a person.
- Create one from a response you just performed (Save as playbook) or from scratch: choose the trigger (a rule key, a severity, an attack class), the steps, and which steps need approval.
- Playbook execution is itself an approval-policy item (Settings → Security → Approval Policies), so you can require sign-off before any playbook runs in production.
- Runs are listed with their outcome and evidence; a failed step stops the run and raises a notification.
Reading the screen
- Playbook actions call the same response actions you can run by hand; there is no second set of powers.
- A playbook triggered by a rule runs when the incident is created, before a person opens it, which is the point.
Secure terminal
enterpriseAn audited command session opened from an incident to act on an affected host through the AsrielNetworks agent: every command and its output are recorded against the incident, so remediation is evidence, not folklore.
Open it when: Containment that needs a shell: isolating a host, stopping a runaway process, pulling a log.
How to use it
- From the incident's Response → Actions choose Open secure terminal on a host that runs the agent.
- The session asks for a fresh second factor and, where the approval policy says so, an approver.
- Commands run through the agent's command channel; output streams back and is stored with the session. Closing the session seals the record into the incident's evidence.
Reading the screen
- Sessions are bound to an incident and an operator; there is no free-floating shell.
- The command channel is the same one firewall rules and isolation actions use, so the host needs the agent, not a new port.
AI estate
AI Agents
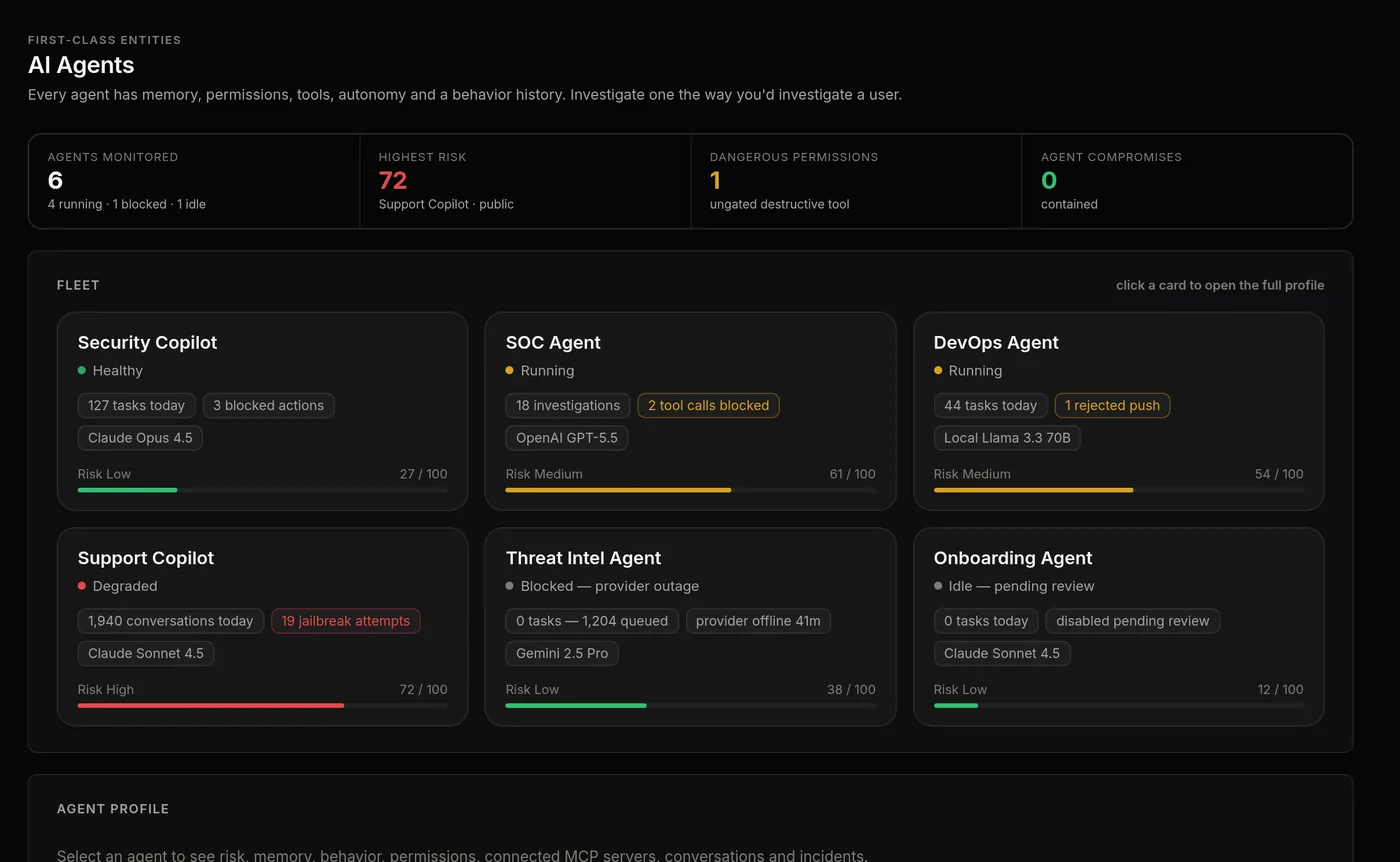
freeEvery agent as a first-class entity, the way you would treat a user: what it is allowed to do, which model it runs on, what it did today, and a risk score that moves with its behaviour.
Open it when: Onboarding a new agent, a weekly review of the fleet, or when the Overview names an agent as the one pulling the risk score up.
How to use it
- Read the fleet tiles: agents monitored (running, blocked, idle), the highest-risk agent, dangerous permissions (ungated destructive tools), and compromises contained.
- Each card shows status, tasks today, blocked actions, the model, and Risk out of 100. Click a card for the full profile: memory, permissions (tool grants), autonomy level, connected MCP servers, conversations and incidents.
- From the profile you can suspend the agent, revoke a grant, or change its autonomy (how much it may do before a person is consulted). Changes take effect on the next tool proposal.
- A Blocked agent (for example after a provider outage or a policy trip) stays visible with the reason; re-enable it from the profile once you are satisfied.
Reading the screen
- Risk reflects what the agent proposed and did, weighted by what was blocked: an agent with many blocked destructive calls scores high even if nothing executed.
- Jailbreak attempts on a card counts inbound attempts against that agent; it is a measure of exposure, not of compromise.
Connect AI
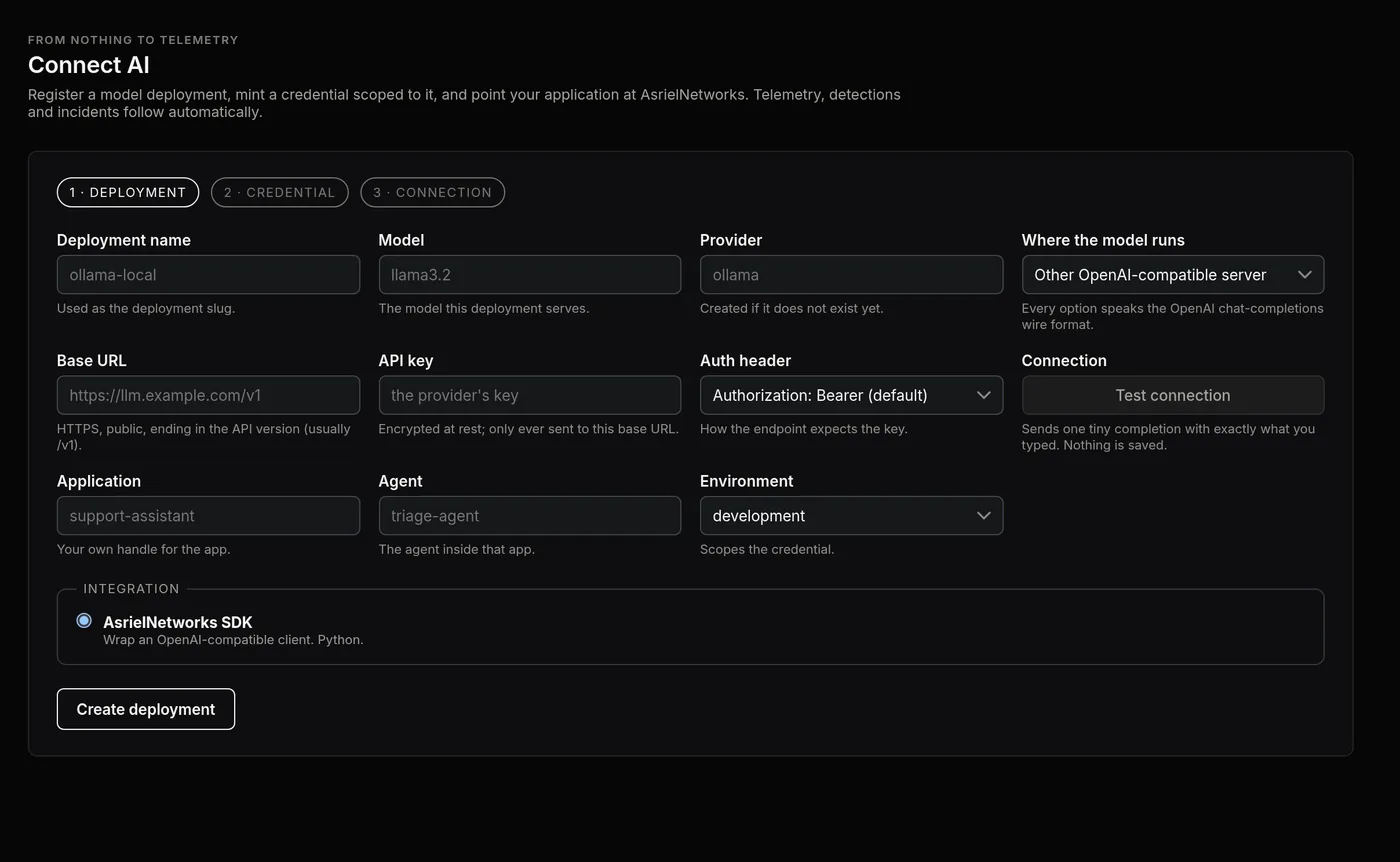
freeThe three-step wizard that turns nothing into telemetry: register the model deployment your application uses, mint a credential scoped to it, and point the application at AsrielNetworks. Detection and incidents follow on their own.
Open it when: First day, and every time you add an application, an agent or a model deployment.
How to use it
- 1 · Deployment. Name it (this becomes its slug), pick the model and provider, say where it runs (OpenAI-compatible server, a cloud provider, self-hosted), and give the base URL and API key. The key is encrypted at rest and only ever sent to that base URL. Test connection sends one tiny completion and saves nothing.
- Choose the application (your own handle for the app), the agent inside it, and the environment (development, staging, production). The credential you mint next is scoped to exactly this triple.
- 2 · Credential. Mint the machine credential. It is shown once; copy it into your runtime's secret store. It carries the scopes it needs (telemetry write) and nothing else, and can be rotated later from Settings without downtime (rotation issues the replacement and revokes the old one at once).
- 3 · Connection. Pick how the app reaches AsrielNetworks: wrap your OpenAI-compatible client with the SDK, route requests through the inline gateway (change one base URL), or post events yourself to the ingest route. The page confirms the first event it sees.
Reading the screen
- Base URL must be HTTPS, public, and end in the API version (usually
/v1); it is validated once here and pinned, so the gateway can never be steered elsewhere later. - One deployment can serve several agents; one credential should serve one agent, so that a leaked key names exactly what it can do.
Models & Guardrails
freeThe operational and the safety half of the same asset in one place: providers, deployments and their health on one side; guardrails, prompt revisions, unsafe outputs and cost on the other.
Open it when: Rolling out a new model or prompt, investigating an unsafe output, checking spend.
How to use it
- Deployments lists what runs (slug, model, provider, environment) with health; register more through Connect AI.
- Providers holds the provider records and the failover provider used when the primary is down.
- Health shows latency, error rate and refusals per deployment over time.
- Guardrails lists the input and output checks in force (the ones your runtime reports through
guardrail.triggered) and how often each fired. - Prompt revisions keeps every system-prompt version the runtime reported, so a behaviour change can be tied to the revision that introduced it.
- Unsafe outputs collects responses a scanner or policy flagged, with the structured verdict and the session they came from. Cost & quotas shows tokens and spend per deployment against the quota you set.
Reading the screen
- A deployment's health and its unsafe-output count are two different questions: a healthy model can still be steered.
- Prompt revisions are recorded from what your runtime emits; the platform does not read your prompt store.
Knowledge (RAG)
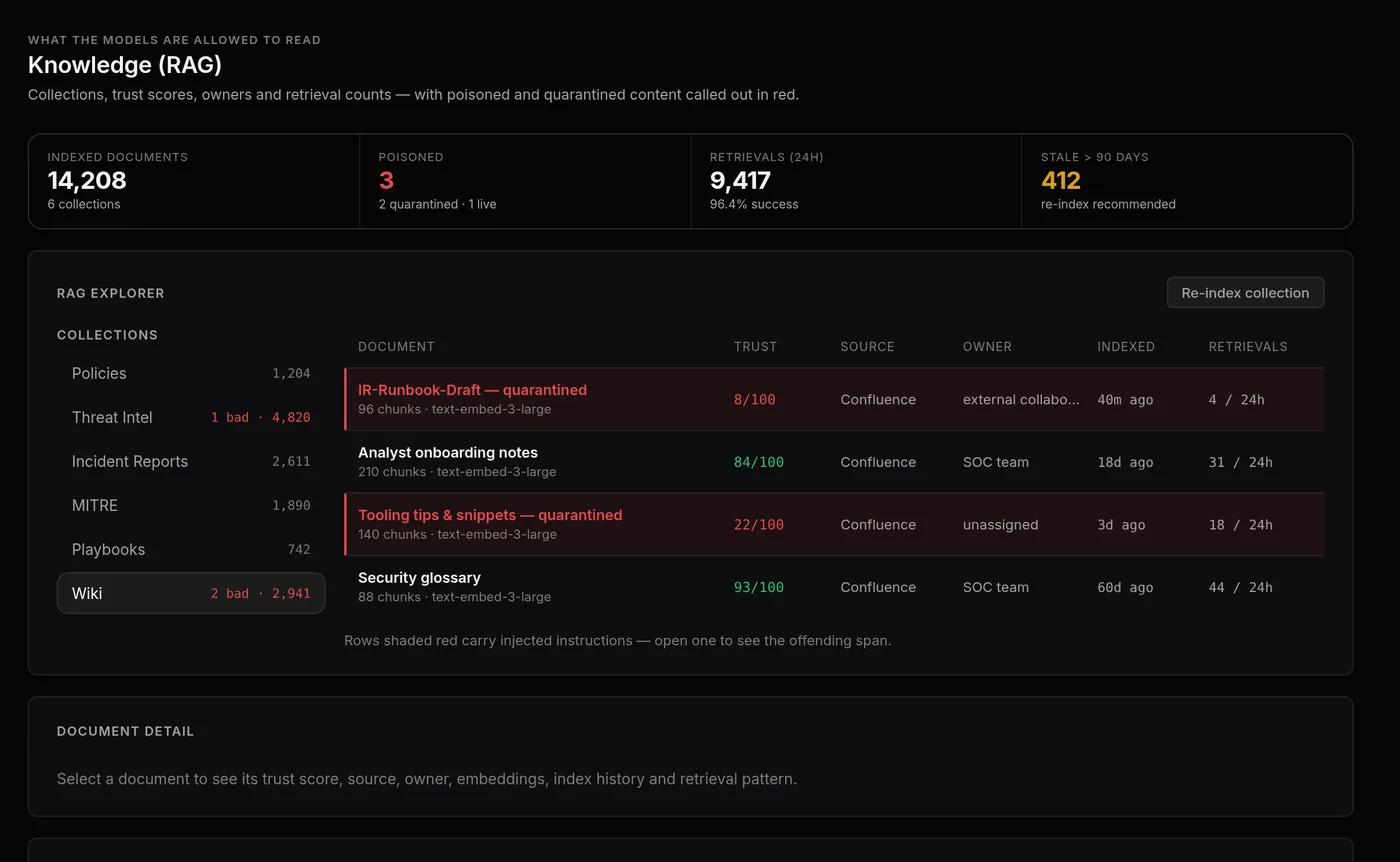
freeWhat the models are allowed to read: every retrieval collection with its trust score, owner, index age and retrieval count, with poisoned and quarantined documents called out in red.
Open it when: After a corpus ingest, when a finding names a retrieved document, and as a periodic hygiene check.
How to use it
- Read the tiles: indexed documents and collections, Poisoned (quarantined and still live), retrievals in 24 hours with their success rate, and Stale documents past 90 days.
- Pick a collection on the left; the explorer lists its documents with Trust out of 100, source, owner, when it was indexed and how often it is retrieved. Rows shaded red carry injected instructions; open one to see the offending span.
- Quarantine a document to keep it in the index but out of retrieval; Re-index collection after cleaning the source. Stale documents are a re-index recommendation, not a finding.
- The document detail shows embeddings, index history and the retrieval pattern (which agents pull it, how often); an unusually popular document is worth reading.
Reading the screen
- Trust is computed from the source, the owner, scanner verdicts and retrieval outcomes; it drops when a retrieval of the document precedes a risky action.
- On Free, RAG visibility is the collection view and quarantine; Pro adds the investigation view that ties a document to the sessions and incidents it influenced.
Tools & MCP
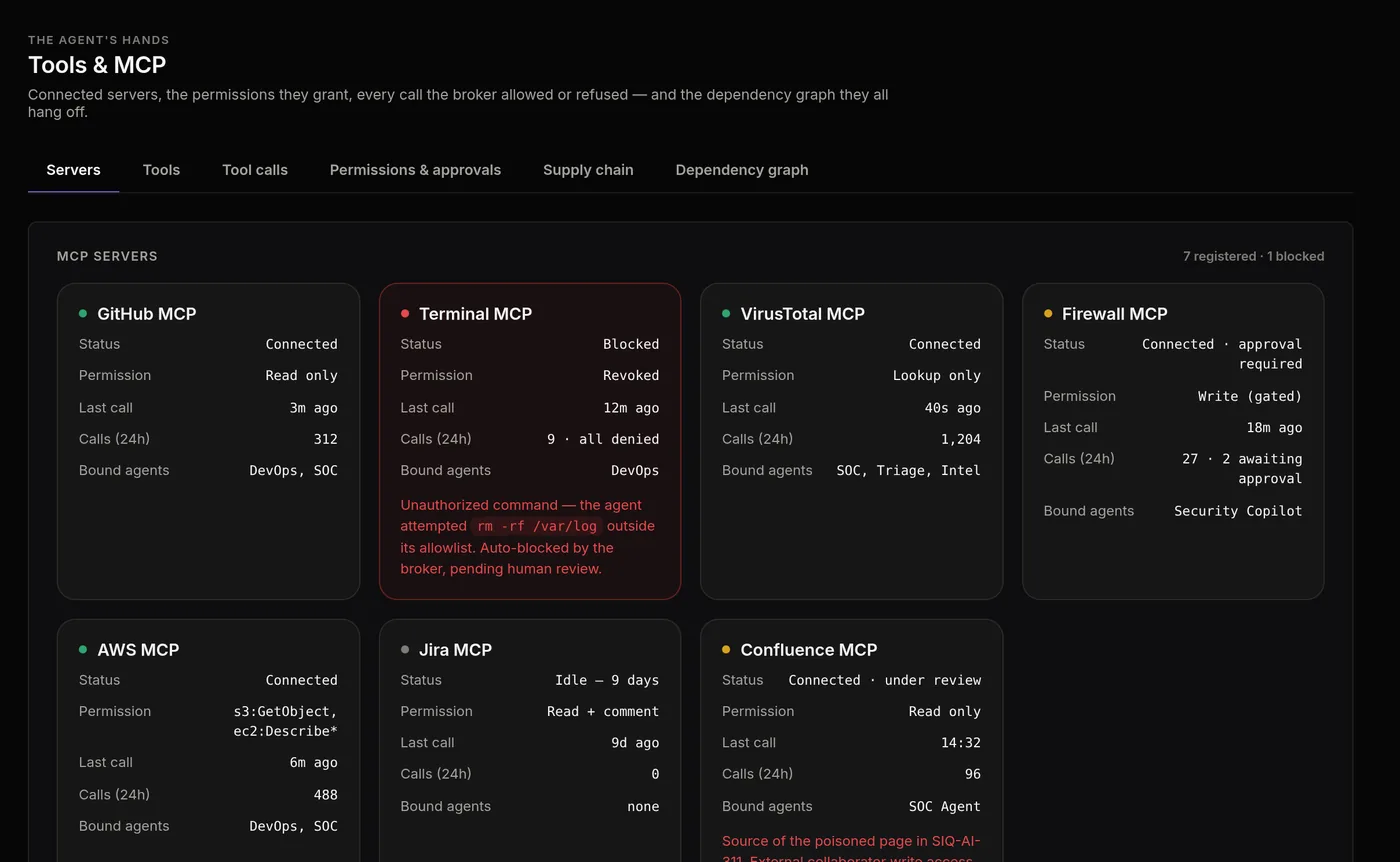
proThe agent's hands: every connected MCP server, the permission it holds, every call the broker allowed or refused, and the dependency graph they all hang off.
Open it when: Adding or reviewing an MCP server, after a blocked destructive call, and during supply-chain reviews.
How to use it
- Servers shows each server with status, permission (read only, lookup only, write gated, revoked), last call, calls in 24 hours and the agents bound to it. A red card is a blocked server with the reason (for example an unauthorized
rm -rfoutside its allowlist, auto-blocked by the broker, pending human review). - Tools lists every tool the servers expose with its class (read, write, destructive, secrets) and description hash; Tool calls is the call log with the broker's decision on each.
- Permissions & approvals is where you gate: require approval for destructive tools, pin description hashes so a changed description blocks the tool, set the outbound host allowlist.
- Supply chain lists servers by origin and manifest signature; Dependency graph shows which agents depend on which servers, so you know the blast radius before you revoke one.
Reading the screen
- Two servers exposing the same tool name raise a finding (
ai.mcp.tool_shadowing); a description with model-directed instructions raises another (ai.mcp.tool_poisoning). - A blocked server keeps its card so the history is visible; re-enable it from the card once the review is done.
Evaluation Lab
enterpriseBefore it ships: benchmark, red-team and stress-test a deployment by driving it through the gateway with adversarial cases and reporting which rules fired, so a change to a prompt, a model or a tool set is measured, not hoped.
Open it when: Every release of a prompt, a model or a tool set; and periodically against production.
How to use it
- New Evaluation: pick the target (a registered deployment), the environment, and the case set (built-in adversarial suites, or your own). The run drives the gateway as a real client would.
- Watch the run: each case shows the response, the findings raised, and whether the guardrail or the policy held. A run is a set of prompt events like any other, so the Explorer and Replay work on it.
- Compare Runs: put two runs side by side (before and after a change) and read the delta in findings per rule.
- Gate a release on the result: the run's report is exportable and can be attached to a case or a governance control.
Reading the screen
- The lab spends real tokens on the target deployment; use the development environment and quotas.
- Evaluation runs are tagged, so they never count as incidents in your production metrics.
Intelligence
AI Threat Intelligence
proWhat is coming for your agents: prompt-injection campaigns, jailbreak families, poisoned datasets, MCP vulnerabilities and model supply-chain advisories, mapped to the agents and models you actually run.
Open it when: Weekly, and when a new advisory lands for a model or an MCP server you use.
How to use it
- Campaigns lists active campaigns with the indicators seen in your tenant; Techniques maps them to ATLAS.
- Supply chain lists advisories for your providers, models and MCP servers; a match is highlighted against your inventory.
- Advisories is the feed; Detection content shows which built-in rules and versions respond to each, so you can see that a new campaign is already covered.
- Pin an advisory to an incident or a case when it explains what you are seeing.
Reading the screen
- Indicators are matched against your own telemetry (tool names, document ids, prompt patterns), so “no indicators match this view” is a real answer, not an empty feed.
- Detection content is versioned with the rules; the rule table on the home page is the same catalogue.
Users Map and attack map
proWhere the people and credentials of the organization act from, on a globe: switch between accounts and machine traffic, search a country, spot a new country or impossible travel.
Open it when: Access reviews, and whenever a credential behaves as if it had moved.
How to use it
- People layer: sign-ins and console activity by location; Traffic layer: machine credentials (SDK, gateway) by source.
- Read the tiles: people seen in 24 hours, located, countries, and Needs a look (a new country, impossible travel between two sign-ins).
- Drag to rotate, scroll to zoom, search to jump. Click a location for the accounts and credentials seen there and open one to its sessions.
Reading the screen
- Locations come from the address the API saw, resolved through the GeoIP provider you configure; behind a proxy, configure the trusted hop count or every user appears in one place.
- The attack map is the same globe with incidents plotted by the source of the prompt or the tool call.
Custom detection rules
enterpriseThe twelve built-in rules are code; on Enterprise you add your own on top: which event types to watch, what structured signals to match, a threshold and window, a severity and confidence. They run in the same engine, on the same traces, and appear in Detection coverage like the built-ins.
Open it when: When your agents have a risk the catalogue does not name: a tool of yours that must never be called after a retrieval from a given corpus, a rate of refusals specific to one deployment.
How to use it
- Open AI Threat Intelligence → Detection content. Built-in rules are listed with their event types, configuration and version; tenant rules sit beside them.
- Create a rule: name and key, the event types it listens to (the platform's vocabulary, for example
tool.proposed,document.retrieved), the condition on the structured fields (tool category, trust level, policy decision), and the threshold and window if it aggregates. - Set severity and confidence; both feed the incident risk score. Enable it for the whole tenant or for named agents.
- Watch it in Detection coverage and the Explorer; tune the threshold before you let it page anyone. Rules are versioned; disabling keeps the history.
Reading the screen
- Custom rules read the same structured signals the built-ins read; they cannot read prompt text you have chosen not to capture.
- A declared tool category can raise a rule's classification but never lower it; the platform treats a downgrade as a finding of its own.
Manage
Settings
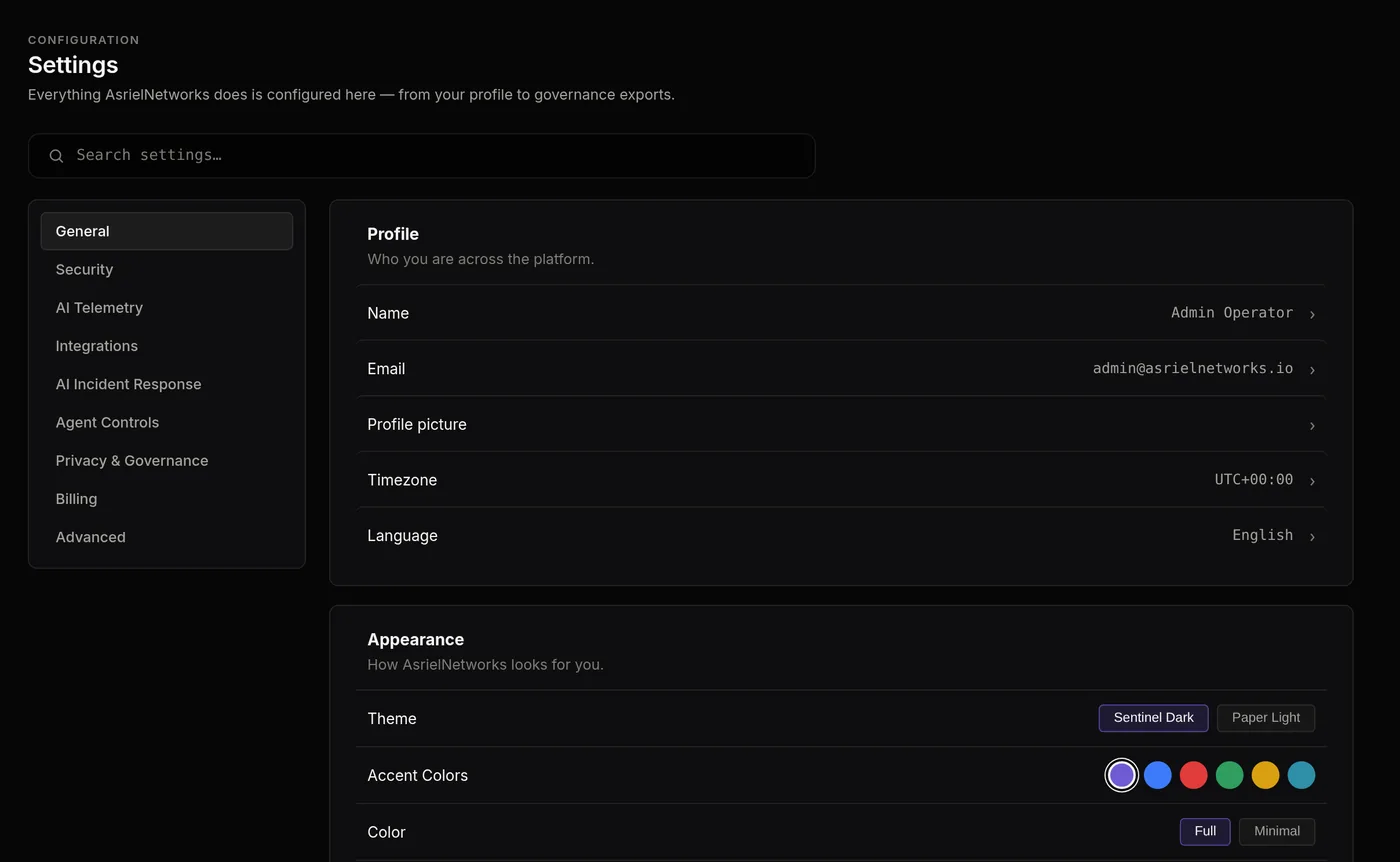
freeEverything the platform does is configured here, from your own profile to what telemetry is captured and how incidents are escalated. It is searchable; type what you are looking for.
Open it when: First day, and whenever a policy question comes up (“do we capture prompt text?”, “who gets paged?”).
How to use it
- General: profile, timezone, language; appearance (theme, accent, density, monospace font).
- Security: password, authenticator app, passkeys, trusted devices, active sessions. Sensitive actions in the console (minting or rotating keys, changing members) ask for a fresh second factor; set one up here first.
- AI Telemetry: what is captured (prompts and responses, retrieved chunks, tool and MCP calls, reasoning summaries), retention, and sampling (full capture for flagged sessions, a sample rate for clean ones, embedding capture).
- Integrations: API keys (create, rotate, revoke), model providers and the failover provider, and the MCP registry (registered servers, whether new servers are auto-approved, whether signed manifests are required).
- AI Incident Response: escalation chains, on-call schedules, severity levels, and the automations (auto-quarantine poisoned documents, auto-suspend on agent compromise, auto-revoke an MCP server on a blocked destructive call).
- Agent Controls: default autonomy level, whether fully autonomous agents are allowed, max tool calls per session, approval for destructive tools, outbound host allowlist, tool description hash pinning, blocked tools.
- Privacy & Governance: retention for the AI audit log, transcripts and evidence bundles; PII redaction in prompts and outputs; consent settings. Billing: plan, limits, usage. Advanced: feature flags, environment, backup and restore.
Reading the screen
- Telemetry settings change what future events carry; they never rewrite what was already captured.
- Access control, SSO, SCIM and approval policies appear under Security on every plan; the ones your plan does not include are shown locked.
Alerts and notifications
freeHow the platform reaches you when it finds something: email on every plan, chat and webhooks on Pro and above, with severity thresholds and quiet hours you control.
Open it when: Right after Connect AI, so the first real incident is not discovered by accident.
How to use it
- Open Settings → AI Incident Response. Set the severity levels you want to be told about and the escalation chain (who first, who next, after how long).
- Under Notifications pick the channels: email alerts on Free; Slack, Microsoft Teams and webhooks from Pro. Each channel gets its own minimum severity.
- Test a channel with the button beside it; the test message names the workspace and the channel so you know which one fired.
- In-app notifications are always on: the bell in the console lists new findings, approvals waiting on you and delivery failures.
Reading the screen
- A notification is created once per incident change, not once per finding, so a noisy trace does not page you ten times.
- Delivery failures (a dead webhook, a revoked Slack token) are shown in the notification list with the reason and retried on a schedule.
Human approval policies
proA gate between a risky proposal and its execution: the agent proposes, the broker holds it, a person approves or refuses, and the decision is recorded against the incident.
Open it when: Any agent that can write, delete, spend or send. Set it up before the agent goes to production.
How to use it
- In Settings → Security → Approval Policies choose what needs a human: agent write actions, identity changes, playbook execution.
- In Agent Controls require approval for destructive tools and set the max tool calls per session.
- Pending requests appear in the bell, in the incident's Response tab and in the Tools & MCP page. Approve or refuse with a reason; either is audited.
- A privileged call that executes without a broker decision, in a trace where other calls were gated, is a finding on its own (
ai.mcp.approval_bypass).
Reading the screen
- Approvals require a fresh second factor from the approver; the console will ask.
- Automations in AI Incident Response (auto-revoke on a blocked destructive call) act without waiting, and then ask for the human decision.
AI Governance
proProof that the AI is under control: posture against EU AI Act, NIST AI RMF and ISO/IEC 42001, the AI System Register behind it, human approval records and the AI audit trail.
Open it when: Audits, board reporting, and vendor questionnaires.
How to use it
- Frameworks: enable the frameworks you are assessed against; each control shows its status and the evidence that satisfies it (a setting, a policy, an approval record).
- AI System Register: every deployment and agent with its purpose, owner, data it touches and risk classification, generated from the estate and completed by you.
- Human approval: the record of who approved what and when; AI audit log: the append-only trail of changes and actions; AI policy: the policies in force and their acceptance.
- Export a framework's evidence bundle for the auditor (Enterprise adds scheduled organization exports).
Reading the screen
- Control evidence is drawn from the platform's own records, so a control is only shown satisfied when the setting or record exists.
- The audit log cannot be edited or deleted, by anyone, including administrators; that is enforced in the database.
Team management
enterpriseMembers, roles and teams under Settings → Security → Access Control: who can see and do what, invitations, and role changes that require a fresh second factor.
Open it when: Onboarding, offboarding, and any time an analyst's role changes.
How to use it
- Users: invite by email; the invitation carries the role. Invitees join the workspace on acceptance; the organization's email roster records who belongs.
- Roles and Permissions: owner, admin, analyst and viewer map to route-level permissions (incident write, integration manage, member invite, and so on); the API enforces them, the console only reflects them.
- Teams: group members for assignment and on-call; the AI Incident Response escalation chain can name a team.
- Removing a member or changing a role asks for a fresh second factor and is written to the audit log.
Reading the screen
- An owner cannot be removed by a non-owner; the last owner cannot remove themselves.
- Lower plans manage members too (within their quota); Enterprise adds teams, SCIM provisioning and the full role model.
Enterprise SSO and SCIM
enterpriseSign in through your identity provider (SAML or OIDC) and provision users from it (SCIM), so joiners, movers and leavers are handled where they already are.
Open it when: Any organization with an identity provider.
How to use it
- Settings → Security → Authentication → Single Sign-On (SAML): paste the IdP metadata (entity id, SSO URL, certificate) or the OIDC issuer and client, and test with your own account before enforcing.
- Identity Providers lists the connection; Require members to sign in through the IdP switches enforcement on. Owners keep a break-glass path with MFA.
- SCIM Provisioning: generate the SCIM token, configure the IdP's provisioning app, and map IdP groups to roles and teams.
- Watch Active Sessions and Login History for the first sign-ins through the IdP.
Reading the screen
- Enforcing SSO ends password sign-ins for members; passkeys and authenticator apps remain as second factors for step-up.
- Deprovisioning through SCIM suspends the membership immediately and revokes sessions.
Organization exports and backups
enterpriseYour data, out: scheduled or on-demand exports of the organization (incidents, evidence, audit log, configuration) as bounded, expiring bundles you can download, plus configuration backup and restore.
Open it when: Audit requests, data-residency obligations, disaster-recovery drills.
How to use it
- Settings → Advanced → Backup & Restore: Create Backup produces a bundle; Export Configuration exports settings alone; Restore Snapshot applies a configuration backup.
- Settings → Privacy & Governance (and Governance → Frameworks → Audit Exports): request an audit export for a period; it is prepared in the background and appears with an expiry.
- Download requires a fresh second factor; every request and download is audited.
- Set the retention for audit log, transcripts and evidence bundles in Privacy & Governance; exports respect it.
Reading the screen
- Exports are stored bounded and expiring inside the platform, never on a public URL.
- Evidence in an export keeps its hashes, so it can be verified against what the console shows.
Assist
AI Co-pilot
proAn assistant docked in the console that answers questions about your own telemetry: “which agents called this tool this week?”, “summarise this incident”, “what changed on Friday?”. It reads the same data you can see and nothing else.
Open it when: Any time a question would otherwise take three pages of clicking.
How to use it
- Open the dock (bottom right). It already knows which page and which incident you are on.
- Ask in plain language. Answers cite the events, agents or documents they came from; click a citation to open it.
- Ask it to draft: an incident summary, a customer-facing note, a ticket. You edit and send; it never sends anything itself.
- It can also run read-only tools on your behalf (search events, list an agent's grants); an action that would change anything is handed to you as a button, not executed.
Reading the screen
- The co-pilot is permission-scoped: it cannot show a member data their role cannot see.
- Its retrieval index is built from your tenant's data on a schedule; a brand-new event may take a few minutes to become answerable.